Evaluation of methods for measuring low frequencies on Arduino. Evaluation of methods for measuring low frequencies on Arduino Connectors used in the FC1100-M2 frequency counter

 Live Journal
 Facebook
 Twitter
Structurally, the device consists of a display formed by seven 7-segment LED indicators, a microcontroller and several transistors and resistors. The microcontroller performs all the necessary functions, so the use of any additional microcircuits is not required.
Schematic diagram The instrument is quite simple and is shown in Figure 2. The Eagle project (schematic diagram and printed circuit board) is available for download in the download section.
The tasks performed by the microcontroller are simple and obvious: counting the number of pulses at the input in 1 second and displaying the result on a 7-digit indicator. The most important point here is the clock accuracy (time base), which is provided by the built-in 16-bit Timer1 timer in CTC mode. The second, 8-bit, timer-counter operates in the mode of counting the number of pulses at its input T0. Every 256 pulses, an interrupt is triggered, the handler of which increments the coefficient value. When the 16-bit timer reaches 1 second, an interrupt occurs, but in this case the factor is multiplied by 256 in the interrupt handler (left shift by 8 bits). The rest of the number of pulses registered by the counter is added to the result of the multiplication. The resulting value is then split into separate digits, which are displayed on a separate indicator in the corresponding digit. After that, immediately before exiting the interrupt handler, both counters are simultaneously reset and the measurement cycle is repeated. In "free time" the microcontroller is engaged in outputting information to the indicator by the method of multiplexing. In the source code of the microcontroller program, the author gave additional comments that will help to understand in detail the algorithm of the microcontroller.
Measurement resolution and accuracy
The measurement accuracy depends on the clock source for the microcontroller. The program code itself can introduce an error (adding one pulse) to high frequencies, but this practically does not affect the measurement result. The crystal used in the device must be of good quality and have a minimum error. The best choice would be a resonator that is divisible by 1024, for example 16 MHz or 22.1184 MHz. To obtain a measurement range of up to 10 MHz, it is necessary to use a quartz resonator for a frequency of 21 MHz and higher (for 16 MHz, as in the diagram, the measurement range becomes slightly below 8 MHz). A 22.1184 MHz quartz resonator is ideal for our device, but acquiring just one with a minimum error for many radio amateurs will be a difficult task. In this case, you can use a crystal resonator at a different frequency (for example, 25 MHz), but you need to perform the procedure for calibrating the master oscillator using an oscilloscope with hardware measurements and a trimmer capacitor in the crystal resonator circuit (Figure 3, 4).
In the download section, several firmware options are available for download for various quartz resonators, but users can compile the firmware for an existing quartz resonator on their own (see comments in the source code).
Input signal
In general, a signal of any shape with an amplitude of 0 ... 5 V, and not just rectangular pulses, can be applied to the input of the device. A sine or triangle waveform can be supplied; the pulse is determined by the falling edge at a level of 0.8 V. Note: the input of the frequency meter is not protected from high voltage and is not pulled up to the power supply, this is an input with a high resistance that does not load the circuit under test. The measurement range can be extended to 100 MHz with a resolution of 10 Hz by using a suitable high-speed frequency divider at the input.
Display
The instrument uses seven 7-segment LED indicators with a common anode as a display. If the brightness of the indicators is insufficient, you can change the value of the resistors that limit the current through the segments. However, do not forget that the value of the pulse current for each pin of the microcontroller should not exceed 40 mA (indicators also have their own operating current, do not forget about its value). In the diagram, the author indicated the nominal value of these resistors is 100 ohms. Insignificant zeros when displaying the measurement result are blanked out, which makes reading the readings more comfortable.
Printed circuit board
The double-sided PCB measures 109 × 23 mm. In the free version of the Eagle PCB design environment, there are no 7-segment LEDs in the component library, so they were drawn by the author by hand. As you can see in the photographs (Figures 5, 6, 7) of the author's version of the printed circuit board, it is additionally necessary to make several connections with a mounting wire. One connection on the front side of the board is power supply to the Vcc pin of the microcontroller (through a hole in the board). There are two more connections on the underside of the board, which are used to connect the pins of the decimal point segment of the indicators in 4 and 7 digits through 330 Ohm resistors to ground. For in-circuit programming of the microcontroller, the author used a 6-pin connector (in the diagram, this connector is shown as a composite JP3 and JP4), located at the top of the printed circuit board. This connector does not have to be soldered to the board; the microcontroller can be programmed in any way possible.
Downloads
Schematic diagram and drawing of the printed board, source code and firmware of the microcontroller -
Built. It allows you to measure frequencies up to 10 MHz in four automatically switching ranges. The smallest range has a resolution of 1 Hz.
Frequency meter specifications
- Range 1: 9.999 kHz, resolution 1 Hz.
- Range 2: 99.99 kHz, resolution up to 10 Hz.
- Range 3: 999.9 kHz, resolution up to 100 Hz.
- Range 4: 9999 kHz, resolution up to 1 kHz.
Description of the frequency counter on the microcontroller
The Attiny2313 microcontroller operates from an external crystal oscillator with a clock frequency of 20 MHz (this is the maximum allowable frequency). The measurement accuracy of the frequency meter is determined by the accuracy of the given quartz. The minimum half-period length of the measured signal must be greater than the period of the crystal oscillator (this is due to the limitations of the ATtiny2313 microcontroller architecture). Therefore, 50 percent of the clock frequency of the generator is 10 MHz (this is the maximum value of the measured frequency).
Installing fuses (in PonyProg):
The description of the frequency meter, which measures the frequency up to 1 MHz, built on the basis of the Arduino UNO board, is given. But, first of all, I want to remind you that Arduino UNO is a small printed circuit board on which the ATMEGA328 microcontroller is located, as well as all its "strapping" necessary for its operation, including a USB programmer and a power supply.
The cost of the Arduino UNO ranges from 200 to 1000 rubles, depending on the place of sale. Of course, the cheapest one on the radio market and the Chinese Internet parcel company "Aliexpress". A description of the Arduino UNO board, as well as the software for it, and the connection to a personal computer is given in L.1, so if anyone is not in the know, be sure to first read the article in L.1.
Schematic diagram
The frequency meter circuit is shown in Fig. 1. As can be seen from the diagram, a 1602A type H1 liquid crystal indicator module is connected to the digital ports D2-D7 of the Arduino UNO board.
And the input signal comes through an understandable amplifier-shaper on a transistor VT1 and a microcircuit D1 to port D8. The input driver and LCD are powered by a 5V voltage regulator on the Arduino UNO board.
Figure: 1. Schematic diagram of a frequency meter (up to 1MHz) on the Arduino UNO platform.
But, back to the LCD display. The indicator is a board on which the LCD itself is installed and a circuit for its maintenance, made on two frameless microcircuits. The 1602A indicator is standard, based on the HD44780 controller. The designation 1602A actually means that it is on two lines with 16 characters per line.
The indicator was bought on Aliexpress, found at the request "HD44780" (prices from 81 rubles).
The + 5V power is supplied to the LCD through pin 2 of its board. General minus for pins 3 and 1. Since it is only planned to transmit information from the controller to the indicator, and not vice versa, pin 5 (RW) is connected to zero. The LCD will receive data through its pins 11-14 (pins 7-10 are not used).
Pins 15 and 16 are used to connect the LCD backlight. They are supplied with 5V voltage. To control the LCD indicator, it was decided to use ports D2 to D7 of the Arduino UNO board. In principle, other ports are possible, but like this, I decided to use these.
The LCD indicator is connected. But he won't work just like that. In order for it to interact with the Arduino UNO, you need to load a subroutine into the program to control it.
Program
For some reason, such subroutines are called "libraries", and there are many different "libraries" in the Arduino UNO software suite.
Table 1. Source code of the program.

The LiquidCrystal library is required to work with the HD44780 based LCD. Therefore, the program for our frequency counter (table 1) begins by loading this library:
This line gives the command to load this library into the Arduino UNO. Next, you need to assign the ports of the Arduino UNO that will work with the LCD display. As I said, I chose ports D2 through D7. These ports are assigned by the line:
LiquidCrystal led (2, 3, 4, 5, 6, 7);
After that, the program proceeds to the actual work of the frequency counter.
Among the set of functions of the Arduino UNO programming language there is such a function: pulseln, which can be translated as "input pulse". This function measures in microseconds the duration of the positive or negative edge of the input pulse. So the frequency measurement here will take place through a preliminary period measurement.
Since the duration of the positive and negative half-periods in a real input signal can differ, if we want to measure the period of the input pulses, we need to add the duration of the positive and negative half-periods.
In the program, the duration of the positive half-period is designated Htime, the duration of the negative half-period is Ltime, and the duration of the entire period is Ttime.
Half periods are measured in lines:
Htime \u003d pulseln (8, HIGH);
Ltime \u003d pulseln (8, LOW);
Then, the full period is calculated in the line:
Ttime \u003d Htime + Ltime;
The calculation of the frequency, given that the value of the period is expressed in microseconds, occurs here:
frequency \u003d 1000000 / Ttime;
Then, the line of the LCD indicator is indicated (the bottom line, this is line 1), in which the result is written:
lcd.setCursor (OD);
And the result is written to the LCD:
lcd.print ("hz");
The working cycle of the frequency meter ends with the indication of the result for one second, or rather, with a pause of one second, during which the display remains
measured value (time is expressed in milliseconds, therefore 1 sec \u003d 1000): delay (1000);
Thus, our frequency counter, unlike a typical one, does not count pulses over a fixed time interval, but determines the frequency from a previously measured period. In this case, the readings change every second. Which, however, is not necessary.
The period for changing readings (indication time) can be set to any value by changing the pause duration in the line:
for example, like this: delay (2000);
The readings will now change every two seconds. You can choose any other value, either less than 1000 or more, but you should not get too carried away with decreasing it - excessively frequent change of readings makes it difficult for visual perception. In my opinion, -1 second is optimal.
Now about other details of the program.
In line:
pinMode (8, INPUT);
port 8 of the ARDUINO UNO board is assigned as a digital input. It receives pulses, the frequency of which must be measured.
In line:
lcd.begin (16,2);
it is indicated that the indicator is two-line, 16 characters per line.
Our indicator is two-line. One line remains free and you can write anything to it. Here the top line (top line, this is line 0) contains the word "frequency":
lcd.setCursor (0,0);
lcd.print ("frequency");
Unfortunately, the Chinese LCD indicator does not understand Russian, so you can write only in Latin letters. If you try to write in Cyrillic, for example, the word "frequency", he begins to swear vilely in Chinese characters. If no signal is received at the input (port D8 ARDUINO UNO), the LCD will blink: "infhz". The operation of the frequency counter can be accelerated or slowed down by changing the display time, as described above.
The accuracy of the frequency counter is very high, because the clock frequency of the microcontroller is stabilized by a quartz resonator installed on the ARDUINO UNO board. However, given the specifics of the device, in particular the fact that it actually measures the period, and not the frequency, and only calculates the frequency, with a highly distorted input signal, the readings can float.
This frequency meter is designed to measure the frequency of the input signal. But there are other frequency meters, for example, tachometers, speedometers, etc., which receive impulses from some sensors, and the result should be given not in hertz, but in revolutions per minute or meters per second, kilometers per hour or other units. In this case, you can change the law of converting the measured period into the result in this line:
frequency \u003d 1000000 / Ttime;
substituting another value instead of 1,000,000, or even changing the formula for calculating the result, according to the one that is necessary for a specific application of the device. Accordingly, it will be necessary to change the unit of measurement, replacing it in the line: lcd.print ("hz"); And change the title on the top line of the LCD by changing it on the line: lcd.print ("frequency");
The supply voltage of the frequency meter can be from 7 to 12V. Power is supplied to the corresponding socket on the ARDUINO UNO board. The voltage may be unregulated (the board has its own 5V regulator), but
must be well filtered (ripple should be minimal). Power supply is also possible from a 5V source through the USB port, but in this case, the voltage should not only be well filtered, but also stabilized.
The input amplifier circuit consists of the actual input amplifier on the VT1 transistor and the Schmitt trigger on the elements of the D1 microcircuit. By the way, the K561LE5 or K561LA7 microcircuit can be replaced with any CMOS microcircuit in which there are at least three inverters, respectively, changing the circuit.
The input amplifier circuit can be made differently by applying other circuit solutions. But, in any case, there must be a Schmitt trigger, at the output of which there must be rectangular impulses with a swing of at least 3V and no more than 5V.
When powered by a galvanic battery, for example, "Krona" or its analog with a voltage of 9V, in order to save the power supply, you can turn off the backlight of the LCD indicator. To do this, you need to turn on the switch in the break of its output 15 or 16, which turns on the backlight, if needed. If the backlight is not required at all, pins 15 and 16 of the LCD may not be connected at all.
In the stationary mode, when the device is powered from a mains power source, the backlight can be made permanently connected, as shown in the diagram in Figure 1.
When typing a program (Table 1) it is not at all necessary to type what is in the lines after the “; " (semicolon). Because these are comments and explanations that do not affect the operation of the program in any way.
Karavkin V. RK-12-16.
Literature:
1. Karavkin V. Christmas tree flasher on Arduino as a remedy for the fear of microcontrollers. RK-11-2016.
The task, in fact, arose from the need to read the rotational speed of the obturator with an optical sensor installed on a homemade cup anemometer. How many holes there are not drilled in a circle, but when the wind is weak, the frequency from the sensor output will be units of hertz (especially if the sensor is well balanced and lightweight to reduce the starting threshold to the maximum).
Puzzled by this question, I first found out that the standard libraries do not offer anything good in this regard. There is, of course, FreqMeasure and FreqPeriod, but I didn't like them at first glance: they were overly complicated and, moreover, with almost no documentation. To top it all off, the examples attached to them simply did not work for me the first time (I guess why, but I didn’t bother - it’s not interesting to dig into other people's mistakes).
I had to do it myself. Low frequencies need to be measured through a period, so the ideal end result is something like the pulseIn () function, only measuring not the pulse width, but the period. It turned out several options, which I offer the audience in the hope that they will be useful to someone. For each option, the limits of applicability were determined and the advantages and disadvantages were considered in comparison with each other.
Option 1. Redo pulseInLong ()
At first, I got stuck on the pulseIn () function - could it be adapted to this case? In the bowels of the Arduino folders (in the wiring_pulse.c file), a more advanced version of it called pulseInLong () was found. It was introduced, as I found out, somewhere around version 1.6.5, but why this option is better than the original function, I did not understand. Judging by the fact that the function is not included in the official list - or nothing, or has some unexplained limitations. But its structure seemed to me more transparent and easier to alter in the desired direction. The function call looks the same as pulseIn ():Unsigned long pulseInLong (uint8_t pin, uint8_t state, unsigned long timeout)
Three conditionally infinite loops work sequentially in the function (with forced exit at the specified timeout). In the first cycle, a drop is expected to the state specified by the state parameter (HIGH or LOW) - in order to skip the current pulse, in the middle of which we may have hit. In the second, the beginning of the next period (reverse differential) is expected, after which the number of microseconds at the start is determined. Finally, the third cycle is a measurement one, again a drop in the state state is expected, the difference in the number of microseconds is recorded and returned in the function value.
The alteration consists in the fact that after the third cycle, the number of microseconds is not fixed, but a fourth cycle is added, identical to the second. And only after reaching again the same difference as at the start, the number of microseconds is fixed and returned in the value of the function. Thus, we get the duration of the period. The test sketch with the reworked function, which I renamed periodInLong, looks like this in full (some comments are left from the original):
#define Tone_PIN 12 // frequency output - see text #define IN_PIN 8 // frequency detection input volatile unsigned long ttime \u003d 0; // Sensor response period unsigned long periodInLong (uint8_t pin, uint8_t state, unsigned long timeout) (// cache the port and bit of the pin in order to speed up the // pulse width measuring loop and achieve finer resolution.calling // digitalRead () instead yields much coarser resolution.uint8_t bit \u003d digitalPinToBitMask (pin); uint8_t port \u003d digitalPinToPort (pin); uint8_t stateMask \u003d (state? bit: 0); unsigned long startMicros \u003d micros (); // wait for any previous pulse to end while ((* portInputRegister (port) & bit)! \u003d stateMask) (if (micros () - startMicros\u003e timeout) return 0;) // wait for the pulse to start while ((* portInputRegister (port) & bit) \u003d\u003d stateMask) (if (micros () - startMicros\u003e timeout) return 0;) unsigned long start \u003d micros (); // wait for the pulse to stop while ((* portInputRegister (port) & bit)! \u003d stateMask) (if (micros () - startMicros\u003e timeout) return 0;) // wait for the pulse to start while ((* portInputRegister (port) & bit) \u003d\u003d s tateMask) (if (micros () - startMicros\u003e timeout) return 0; ) return micros () - start; ) void setup () (pinMode (IR_PIN, OUTPUT); // to output pinMode (IN_PIN, INPUT); // output of frequency detection to input Serial.begin (9600); // tone (Tone_PIN, 1000);) void loop () (ttime \u003d periodInLong (IN_PIN, LOW, 1000000); // wait 1 sec Serial.println (ttime); if (ttime! \u003d 0) (// in case the frequency has disappeared float f \u003d 1000000 / float (ttime ); // Calculate the signal frequency in Hz Serial.println (f, 1);) delay (500);)
Notice the Tone_PIN output and the commented out call to tone () in the setup () section. This is done to check one more circumstance, which is discussed at the end of the article.
To test the operation, a signal from a homemade oscillator based on a clock crystal and a 561IE16 counter divider was fed to pin 8 (arbitrarily selected as IN_PIN). At its output, we get frequencies that are multiples of powers of two, from 2 to 2048 Hz, as well as 16384 Hz (and, if desired, another 32768 Hz directly from the generator).
The sample results of sequential measurements for frequencies 2, 8, 64, as well as 2048 and 16384 hertz are combined into one table in the figure (the top line is the duration in microseconds, the next is the calculated frequency):
As we can see from these data, the method works quite satisfactorily for low frequencies (below about 100 hertz), but “rattles” at high frequencies. This is fine if you remember that the micros () function is tied to overflows and Timer0 counters, and its call and manipulation of a long integer take a significant amount of time. Simple conditionally infinite loops in controllers are, in principle, not a very reliable thing.
The huge advantage of this method is that it allows you to use any digital output of the controller as a measuring one. The disadvantage is that the main loop freezes for the duration of the measurement (for units of hertz it takes a crazy fraction of a second, by the standards of the controller) and at the same time it is not very desirable to use any other interrupts. Two other methods are practically devoid of this drawback, but they are tied to certain conclusions of the controller.
Method 2. Ideologically correct: use Timer1
Actually, this method should have been implemented in pure assembler, and not in the Arduino environment, then it would be possible to extract the maximum possible from it. But even so, given our frequency range of units to tens of hertz, it will turn out well.The way is that we run the 16-bit Timer1 in two modes at once: counting and capturing events. When counting, it is convenient to set the clock frequency divider to 1/8, then in the 16MHz controller we will count the time in ticks at half a microsecond. On overflow (65536 half a microsecond), an overflow interrupt is invoked, which increments the counter of the third bit (byte) of the long number. Three byte bits (16777216 half a microsecond or about 8 seconds) are quite enough for our purposes of calculating the frequency period of the order of units or tens of hertz. By capturing the level drop event, we fix the three-digit number of ticks that have passed since the previous such event (collecting it from the values \u200b\u200bof the timer registers plus the third most significant bit), reset all variables and counting registers and wait for the next drop. In theory, the counters of the clock frequency prescaler should also be cleared, but they will still change when Timer0 is running (the prescaler for timers 0 and 1 is common), and with a divider of 1/8 this error will be insignificant.
Details for the curious: why this method is ideologically correct
This method is ideologically correct because everything happens within one timer, which is no longer affected by anything: the counting is mostly done in hardware. In principle, some error here can occur only when the call to the timer interrupt is delayed due to a coincidence with some other interrupt. But in general, this is such an incredible event that it can be ignored.
I suppose there will be quite a few people who want to challenge this statement. There are a lot of sources on the Web that put forward the thesis that it is dangerous to use interrupts, because you can supposedly lose something. A deeply erroneous opinion: everything is exactly the opposite - it is easy to lose in the loop (), but very difficult in interrupts. A correct program should run primarily on interrupts (except for routines that cannot be used there, like the sleep command). Only then can you squeeze the maximum out of the controller. There are no functions inside the controller that last so long as to significantly interfere with other functions in other interrupts, even if these are operations with long or float numbers. The longest of the operations - division of long numbers - is performed in about 670-680 clock cycles, that is, somewhere in 42 microseconds and it rarely happens more than one for the entire interrupt. The exchange with the external environment takes much longer: for example, the transfer of a byte at a rate of 9600 takes about a millisecond. But long exchange procedures with waiting for a response can be arranged in the program so as not to interfere with measuring or other time-critical operations. And if, nevertheless, your controller turns out to be clogged with lengthy computational procedures, then this means that the platform is incorrectly chosen: go to 32-bit or even to Raspberry Pi.
Let's look at this in more detail with our example. The tick count itself in Timer1 is hardware-based and does not depend on anything. Overflow interrupts for our condition (1/8 clock frequency of 16 MHz) occur every 32 milliseconds. The interrupt itself consists of a single operation of incrementing a one-byte third-bit variable (see below). If I implemented this in assembler, then I would store the third bit in the working register and the operation would take exactly one cycle. In the case of Arduino (and implementations in C in general), the variable is stored in RAM, therefore, several clock cycles are still lost for retrieving / saving in memory. Plus an interrupt call (7 clocks) and a return (4 clocks), that is, the entire procedure duration is on the order of a microsecond or a little more. From the duration of the interval between overflows (32 ms), this is approximately 0.003%. And what is the likelihood that some random event (for example, pressing an external button) will happen at this very moment? Even if you keep pressing the button as fast as you can, you will hardly be able to achieve a match.
But even if this incredible event occurs, the error will be at most the sum of the interrupt durations - ours and the one that handles the interrupting event. And if, as we said, at least for the duration of the measurement one refrains from lengthy procedures such as dividing multibyte numbers or exchanging information through external ports, then when measuring long enough periods, such an error will practically not affect the results.
What can really prevent our interrupts is the periodic updating of the millis () function through the Timer0 overflow interrupt, which occurs every millisecond and lasts for several microseconds (see this function in the wiring.c file). Regarding the system time, our interrupts also occur at a random moment, but the probability of stumbling upon the Timer0 interrupt is already on the order of a percent, which is a lot. If you want to go on about your perfectionism, then, strictly speaking, you should turn off Timer0 during measurements. But if we take into account that the maximum error is a few microseconds, and we measure periods from thousands to hundreds of thousands of microseconds, then this error can be ignored.
I will say right away: everything will look somewhat different when all these events are not random relative to each other. This will happen if the triggering edge is synchronized with the clock generator of the controller itself. It is for the purpose of checking what is happening in this situation, in the sketch there is a commented out function tone (). The results of such a check are at the end of the article.
A sketch to test this idea looks like this:
#define Tone_PIN 12 // frequency output - see text #define IN_PIN 8 // frequency detection input / ICP1 - for memory volatile byte time2 \u003d 0; // most significant bit of time, two lower ones - timer registers volatile unsigned long ttime \u003d 0; // Sensor response time volatile unsigned long time_old \u003d 0; // Previous time volatile uint8_t flag \u003d 0; void setup () (pinMode (IR_PIN, OUTPUT); // to the pinMode output (IN_PIN, INPUT); // frequency detection output to the input // setting the timer1 registers TCCR1A \u003d 0; // Set the edge capture and 1/8 divider to clock frequency 16MHz TCCR1B \u003d 1<
And where is the trigger timeout?
By the way, really, what happens if there is no input frequency at all? This situation is not handled in any way, because it is not required for the safe execution of the program. If you leave input 8 connected to some potential, then the value of the period (variable ttime) simply will not change - it will retain what was before. If it was some kind of frequency, it will be displayed. If from the moment of loading not a single pulse has slipped, then there will be zero (in this case, and the limitation of the output). And if, by the way, we leave input 8 hanging in the air, then 50 Hz interference will be measured with a fairly high accuracy.
Of course, if, according to the measurement conditions, it is necessary to somehow work out the situation of lack of frequency at the input, then you can enter a timeout for waiting for the capture. For example, this can be done through control in the main loop of the state of the same flag, the value of which will need to be changed in the capture interrupt. Now it will report that an interrupt occurred (or did not occur within a specified time). And it will be advisable to use the measurement result when the measurement actually occurs, according to the state of the flag.
The measurement results for the same frequencies 2, 8, 64, as well as 2048 and 16384 hertz are combined in the table:

Note that even for high frequencies, interval measurements give fairly stable results, if they differ from each other, then in the legal unit of the least significant bit. But for high frequencies, a systematic error of two extra microseconds is noticeable, which makes the frequency values \u200b\u200boverestimated. Probably, this is the influence of the simultaneously working Timer0, but for the frequencies we need in units of tens of hertz, the error will not matter. In addition, it is quite easy to take it into account in the calculations, if necessary, by calibrating the sketch using an exemplary frequency meter.
Method 3. The simplest: by external event
This is the simplest and most obvious way. We start an external interrupt (on the edge on the output) and at the same time fix the system time with the same micros () function. As soon as the second such interruption occurs, we calculate the difference and thus get the period.There should be more sources of errors here, because the counter and external interrupts are systematically separated and a certain time passes before the readings are fixed. But, firstly, it can be expected that for long periods they will not matter, and secondly, in reality it turned out even better than expected.
A sketch that implements this idea looks like this:
#define Tone_PIN 12 // frequency output - see text #define IN_PIN 2 // frequency detection input volatile unsigned long ttime \u003d 0; // Sensor response time volatile unsigned long time_old \u003d 0; // Previous time volatile uint8_t flag \u003d 0; void setup () (pinMode (IR_PIN, OUTPUT); // to pinMode output (IN_PIN, INPUT); // frequency detection pin to input attachInterrupt (0, impuls, RISING); // Interrupt on rising edge on D2 Serial.begin (9600); // tone (Tone_PIN, 8); delay (1000);) void impuls () (if (flag! \u003d 1) ttime \u003d micros () - time_old; time_old \u003d micros ();) void loop () (flag \u003d 1; // so that ttime does not change during output Serial.println (ttime); if (ttime! \u003d 0) (// in case there is no frequency float f \u003d 1000000 / float (ttime); // Calculate the signal frequency in Hz Serial.println (f, 1);) flag \u003d 0; delay (500);)
The interrupt input here will be different - pin number 2 (pin PD2). As before, the flag protects against ttime being changed during output. Regarding the lack of input frequency, the same considerations apply here as in the previous case. The measurement results of the same frequencies are presented in the table:
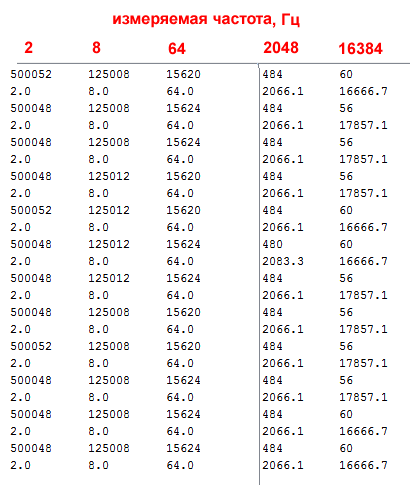
As we can see, here the error in measurements is in full accordance with the resolution of the micros () function, equal to 4 μs - that is, in fact, the result fluctuates within plus or minus one tick of the system timer, everything is legal. This does not have the best effect on high frequency measurements, but it is quite suitable for our range. Therefore, this method can be recommended for common applications.
Measurement by the controller of the frequency generated by itself
In general, this is a purely cognitive task, probably having no practical application. But I wondered: what would happen if the measured frequency comes from the controller itself? It is convenient for this to use the tone () function, which takes Timer2, and therefore will not overlap either with the system time or with Timer1 if used for measurement. That is why in each of the sketches this function is inserted, which works through the Tone_PIN pin.For each of the sketches, the function was uncommented, and first it was checked whether the parallel operation of the tone () function does not affect measurements at different combinations of frequencies, both measured and generated. In none of the options was there a clear impact. Then the Tone_PIN pin was connected directly to the frequency measurement input IN_PIN and the port monitor was started to monitor the results.
Actually, I expected to see one of two options as a result: a) measurements will work as if nothing had happened; b) or, rather, the measurements will shamelessly lie, and with a regular systematic error (which should have been due to the addition of oscillations of two dependent timers). The reality turned out to be more interesting than assumptions: the measurements in all three cases worked fine, but in a limited range of specified frequencies. Moreover, the lower limit was determined precisely: the input period was correctly measured, starting from a frequency of 32 hertz. I did not begin to determine the upper limit precisely - it is too troublesome, but approximately it is located slightly above 1000 Hz. Anything lower or higher is determined absolutely wrong. Moreover, what is most interesting, without any particular pattern: the readings in one series are the same, but after a reboot with the same set values, they become completely different.
I do not undertake to explain these results, but, probably, this is not really necessary. In practice, such a regime, as I have already said, is useless, and in case of need it is enough to recall these empirical laws.

The main feature of this frequency meter:
a highly stable TCXO (Thermo-Compensated Reference Oscillator) is applied. The use of TCXO technology allows you to immediately, without preliminary warming up, ensure the declared frequency measurement accuracy.
FC1100-M2 frequency meter specifications:
| parameter | minimum | norm | maximum |
| Measured frequency range | 1 Hz. | - | 1100 MHz. |
| Frequency readout resolution from 1 to 1100 MHz | - | 1 kHz. | - |
| Frequency counting resolution from 0 to 50 MHz | - | 1 Hz. | - |
| Input level for input "A" (1 to 1100 MHz). | 0.2 V. * | 5 V. ** | |
| Input level for input "B" (0 to 50 MHz). | 0.6 V. | 5 B. | |
| Reading update period | - | 1 time / sec | - |
| Testing quartz resonators | 1 MHz | - | 25 MHz |
| Supply voltage / current consumption (Mini-USB) | + 5V. / 300mA | ||
| Frequency stability @ 19.2MHz, at temperature -20C ... + 80C | 2ppm (TCXO) |
Distinctive features of the FC1100 and FC1100-M2 frequency meters in particular:
| Highly stable reference generator TCXO (stability is not worse than +/- 2 ppm). | |
| Factory calibration. | |
| Independent simultaneous measurement of two frequencies (Input "A" and Input "B"). | |
| Input "B": Provides 1 Hz frequency measurement resolution. | |
| Input "B" has a full-fledged analog control of the threshold of the input comparator (MAX999EUK), which makes it possible to measure the signals noisy with harmonics, adjusting the threshold of the comparator to a clean section of the periodic signal. | |
| Input "A" allows you to remotely measure the frequency of portable VHF radios at a distance of several meters using a short antenna. | |
| Quick test function for quartz resonators from 1 to 25 MHz. | |
| Modern TFT color display with economical backlighting. | |
| The manufacturer does not use unreliable electrolytic capacitors. Instead, modern high-quality SMD ceramic capacitors of significant capacities are used. | |
| Unified power supply via Mini-USB (+ 5v). Mini-USB power cord - supplied. | |
| The construction of the frequency counter is optimized for integration into a flat front panel of any housing. The set includes nylon insulating racks M3 * 8mm., To provide a gap between the front panel and the printed circuit board of the frequency meter. | |
| The manufacturer guarantees that programmed aging technologies that are widespread in modern technology are not used. | |
| Manufactured in Russia. Small batch production. Quality control at every stage of production. | |
| The production uses the best solder pastes, no-clean fluxes and solders. |
FC1100-M2 PCB dimensions: 83mm * 46mm.
Display color TFT LCD with backlight (diagonal 1.44 "\u003d 3.65 cm).
* Sensitivity according to DataSheet MB501L ("Input Signal Amplitude" parameter: -4.4dBm \u003d 135 mV @ 50 Ohm, respectively).
** The upper limit of the input signal is limited by the dissipation power of the protective diodes B5819WS (0.2 W * 2 pcs).
The reverse side of the FC1100-M2 frequency meter

Comparator / shaper circuit for 0 ... 50 MHz input signal.

Input signal frequency divider circuit 1 ... 1100 MHz.

Brief description of the FC1100-M2 frequency meter:
The FC1100-M2 frequency counter has two separate frequency measurement channels.
Both channels of the FC1100-M2 frequency counter operate independently of each other and can be used to measure two different frequencies at the same time.
In this case, both values \u200b\u200bof the measured frequency are simultaneously displayed on the display.
"Input A" - (Connector type SMA-FEMALE) Designed to measure relatively high-frequency signals, from 1 MHz to 1100 MHz. The lower threshold of sensitivity of this input is slightly less than 0.2 V., and the upper threshold is limited to 0.5 ... 0.6 V. by protective diodes connected in anti-parallel. It makes no sense to apply significant voltages to this input, because voltages above the protective diode opening threshold will be limited.
The applied diodes allow dissipating power no more than 200 mW, protecting the input of the MB501L divider microcircuit. Do not connect this input directly to the output of transmitters of significant power (over 100 mW). To measure the frequency of signal sources with an amplitude of more than 5 V., or significant power, use an external voltage divider (attenuator) or a low-capacity transient capacitor (picofarad units) connected in series. If it is necessary to measure the frequency of the transmitter - usually a short length of wire is sufficient as an antenna connected to the frequency counter connector and located a short distance from the transmitter antenna, or you can use a suitable "rubber band" antenna from portable radios connected to the SMA connector.
"Input B" - (Connector type SMA-FEMALE) Designed to measure relatively low-frequency signals, from 1 Hz to 50 MHz. The lower sensitivity threshold of this input is lower than that of "Input A" and is 0.6 V., and the upper threshold is limited by protective diodes at 5 V.
If you need to measure the frequency of signals with an amplitude of more than 5 V. use an external voltage divider (attenuator). A high-speed comparator MAX999 is used at this input.
The input signal is fed to the non-inverting input of the comparator, and resistor R42 is also connected here, which increases the hardware hysteresis of the MAX999 comparator to a level of 0.6 V. The bias voltage is applied from the variable resistor R35 to the inverting input of the MAX999 comparator, which sets the comparator operation level. When measuring the frequency of noisy signals, it is necessary to rotate the knob of the variable resistor R35 to achieve stable readings of the frequency meter. The highest sensitivity of the frequency meter is realized in the middle position of the handle of the variable resistor R35. Rotation counterclockwise - decreases, and clockwise - increases the threshold voltage of the comparator, allowing you to shift the threshold of the comparator to a noise-free section of the measured signal.
Press the "Control" button to switch between the "Input B" frequency measurement mode and the quartz resonator test mode.
In the test mode of quartz resonators, to the extreme contacts of the "Quartz Test" panel, it is necessary to connect the tested quartz resonator with a frequency from 1 MHz to 25 MHz. The middle contact of this panel can be left unconnected, it is connected to the "common" wire of the device.
Please note that in the quartz resonator test mode, in the absence of the tested crystal in the panel, constant oscillation is observed at a relatively high frequency (from 35 to 50 MHz).
Also, it should be noted that when the investigated quartz resonator is connected, the generation frequency will be slightly higher than its typical frequency (within units of kilohertz). This is determined by the parallel mode of excitation of the quartz resonator.
The test mode for quartz resonators can be successfully used to match the same quartz resonators for ladder multichip crystal filters. In this case, the main criterion for the selection of quartz resonators is the closest possible generation frequency of the selected quartz.
Connectors used in the FC1100-M2 frequency meter:
Power supply for Frequency Counter FC1100-M2:
The FC1100-M2 frequency counter is equipped with a standard Mini-USB connector with a supply voltage of +5.0 Volts.
Current Draw (300mA max) - Provides compatibility with most USB voltage power supplies.
Comes with a Mini-USB cable<> "USB A", which allows you to power the frequency meter from any device that has such a connector (Personal Computer, Laptop, USB-HUB, USB Power Supply, USB Network Charger) and so on.
For autonomous power supply of the FC1100-M2 Frequency Counter - the widespread "Power Bank" batteries with built-in Lithium-Polymer accumulators, which are usually used to power equipment with USB connectors, are optimal. In this case, in addition to obvious convenience, you get a galvanic isolation from the network and / or the power supply as a bonus, which is important.


- Do I need to issue an insurance policy when registering a car
- What can collectors do with a debtor?
- The consequences of recognizing individual residential premises as unsuitable for permanent residence (Zubova Yu.
- Registration in a privatized apartment: what does it give, who and how many people can you register?
- Should I sue the tax office?
- How to buy an apartment with housing and communal services debts without consequences?
- What to do if you bought an apartment with communal debt